Key Benefits of Microsoft Power BI.
Microsoft Power Platform is a suite of tools used by businesses and individuals to innovate, adapt, and improve using low-code programming solutions. Users can connect business processes across many platforms such as Microsoft 365, Microsoft Azure, and hundreds of other cloud based apps.
We have previously looked at Power Apps and Power Automate, this month we will look at how to leverage your business data to aid decision making and inform your strategies with Power BI. If you have a data analysis task to complete , Power BI is one of the business applications that can be used to great effect.
The Power of Data Visualisation In Power BI
Most organisations understand the need to monitor key performance indicators to ensure their businesses are running as expected. But the amount of data available to business owners, especially retailers, is growing exponentially and the ability to accumulate, interrogate and act on this data is vital to survival in a market where constant change is the norm.
Big Data, and an organisation’s ability to utilise it quickly and effectively, has become a key factor in staying ahead of the competition. Companies are using Data Lakes to retain data from all areas of the business which can be used for intelligent data analysis and visualise trends and opportunities that may have previously been missed. Data analysis can be extremely personalised and localised, depending on what your business needs.
“I've enjoyed unlocking stories with people's data that they never knew existed.”
- Terry Y, Senior Finance BI Manager + Data Artist
What is Microsoft Power BI?
Power BI is a leading cloud native tool for self-service and enterprise business intelligence (BI) that transforms raw, real-time data, from a wide variety of sources, into reports and visual dashboards seamlessly infused with the apps you use every day. It is a simple and intuitive way to bring your business data to life and into the hands of decision makers.
Power BI allows you to make the most of your organisation’s big data with intelligent data analysis and actionable insights while maintaining data accuracy, consistency, and security. Empower everyone in your organisation to quickly make data-driven decisions that drive strategic actions and harness the power of industry-leading AI to quickly drill down on your data.
As Power BI interoperates with the Microsoft technology you are familiar with, your team can get to the heart of your data quickly and productively. It’s one of the business applications in your Microsoft suite that is worth getting to know.
Microsoft has been named a Magic Quadrant Leader in analytics and business intelligence platforms once more by Gartner.
Microsoft is once again ranked best in its ability to execute and completeness of vision for the fourth consecutive year.
Discover why Microsoft has once again been positioned as a Magic Quadrant Leader in analytics and BI by reading this study.
This graphic was published by Gartner, Inc. as part of a larger research document and should be evaluated in the context of the entire document. The Gartner document is available upon request from Microsoft.
Secure
Thanks to multiple security features, including utilising Microsoft Cloud App Security, Power BI ensures secure data analytics across various roles and user groups. Data is saved on Microsoft azure servers, so no need for extra servers.
Cost Effective
Microsoft Enterprise Agreement customers already have access to Power BI, otherwise the platform is available as Pro or Premium packages allowing you to choose the best option for your organisation.
AI Capabilities
Take advantage of powerful, industry-leading AI capabilities built into the Power BI platform, such as Key Influencers visualisation and Decomposition Tree visualisation, as well as the Q&A visualisation.
Top 3 Benefits of Microsoft Power BI
“Power BI has allowed us to automate mundane work, create efficient workflows, and make data-driven decisions.”
- Nipa C, Microsoft General Manager IT + Decision Driver
1 Drive Innovation with Democratised Data
Power BI lets you open up your business data to everyone in your organisation and create a data-driven culture to keep you ahead of the competition.
The simple, intuitive drag-and-drop functionality allows even the most inexperienced users to prepare data, build reports and design dashboards that garner valuable insights from both structured and unstructured data, including text and images. With unparalleled Excel interoperation, users familiar with Microsoft 365 can apply existing knowledge to connect Excel queries, data models, and reports to Power BI Dashboards.
Not only is Power BI user friendly, but it’s also user driven. Regular monthly updates to the platform provide improved features and capabilities thanks to practical suggestions from the community of over half a million users worldwide.
With access to easily interpretable real-time analytics, whether from factory sensors, in-store sales or social media sources, your company’s decision makers have the tools to quickly turn timely insights into actionable strategies in an ever-changing market.
2 Your Data, Your Story
Power BI makes it easy to create data dashboards and visualisations to help users quickly understand and interpret your business data, it is fully customisable to include your branding and insert seamlessly in apps across your organisation.
Beyond bar graphs and pie charts, Power BI offers the ability to truly bring your data to life with stunning, interactive data storytelling. Complex data can be made more accessible through engaging, interactive visuals that promote increased comprehension, retention and appeal.
Take advantage of tried and tested visuals in seconds from an extensive library of data visualisations, with hundreds more available in AppSource, all of which integrate seamlessly with Power BI. If you can’t find exactly what you need, with some training, you can tailor custom data visualisations to your requirements and help your organisation stand out with something unique.
3 Dive Deeper with AI Visuals
With built-in industry-leading AI capabilities, Power BI ensures you get more from your data and reporting. There are three powerful AI visualisations that help you discover meaningful insights that may be otherwise overlooked.
Sometimes the easiest way to get the information you’re after is to just ask. The Q&A visualiser lets users ask simple, natural language queries to gain insights into available data sets. Using Natural Language Processing (NLP) technology, the visualiser picks up on key parts of the query to offer simple, succinct answers, cutting through the noise to get to the heart of your data.
The Key Influencers visualiser analyses your data, ranks the factors that make the most impact, and displays them as key influencers. There can be many factors that drive any given metric in your data, and discovering which factors are most influential can help you focus on what’s important.
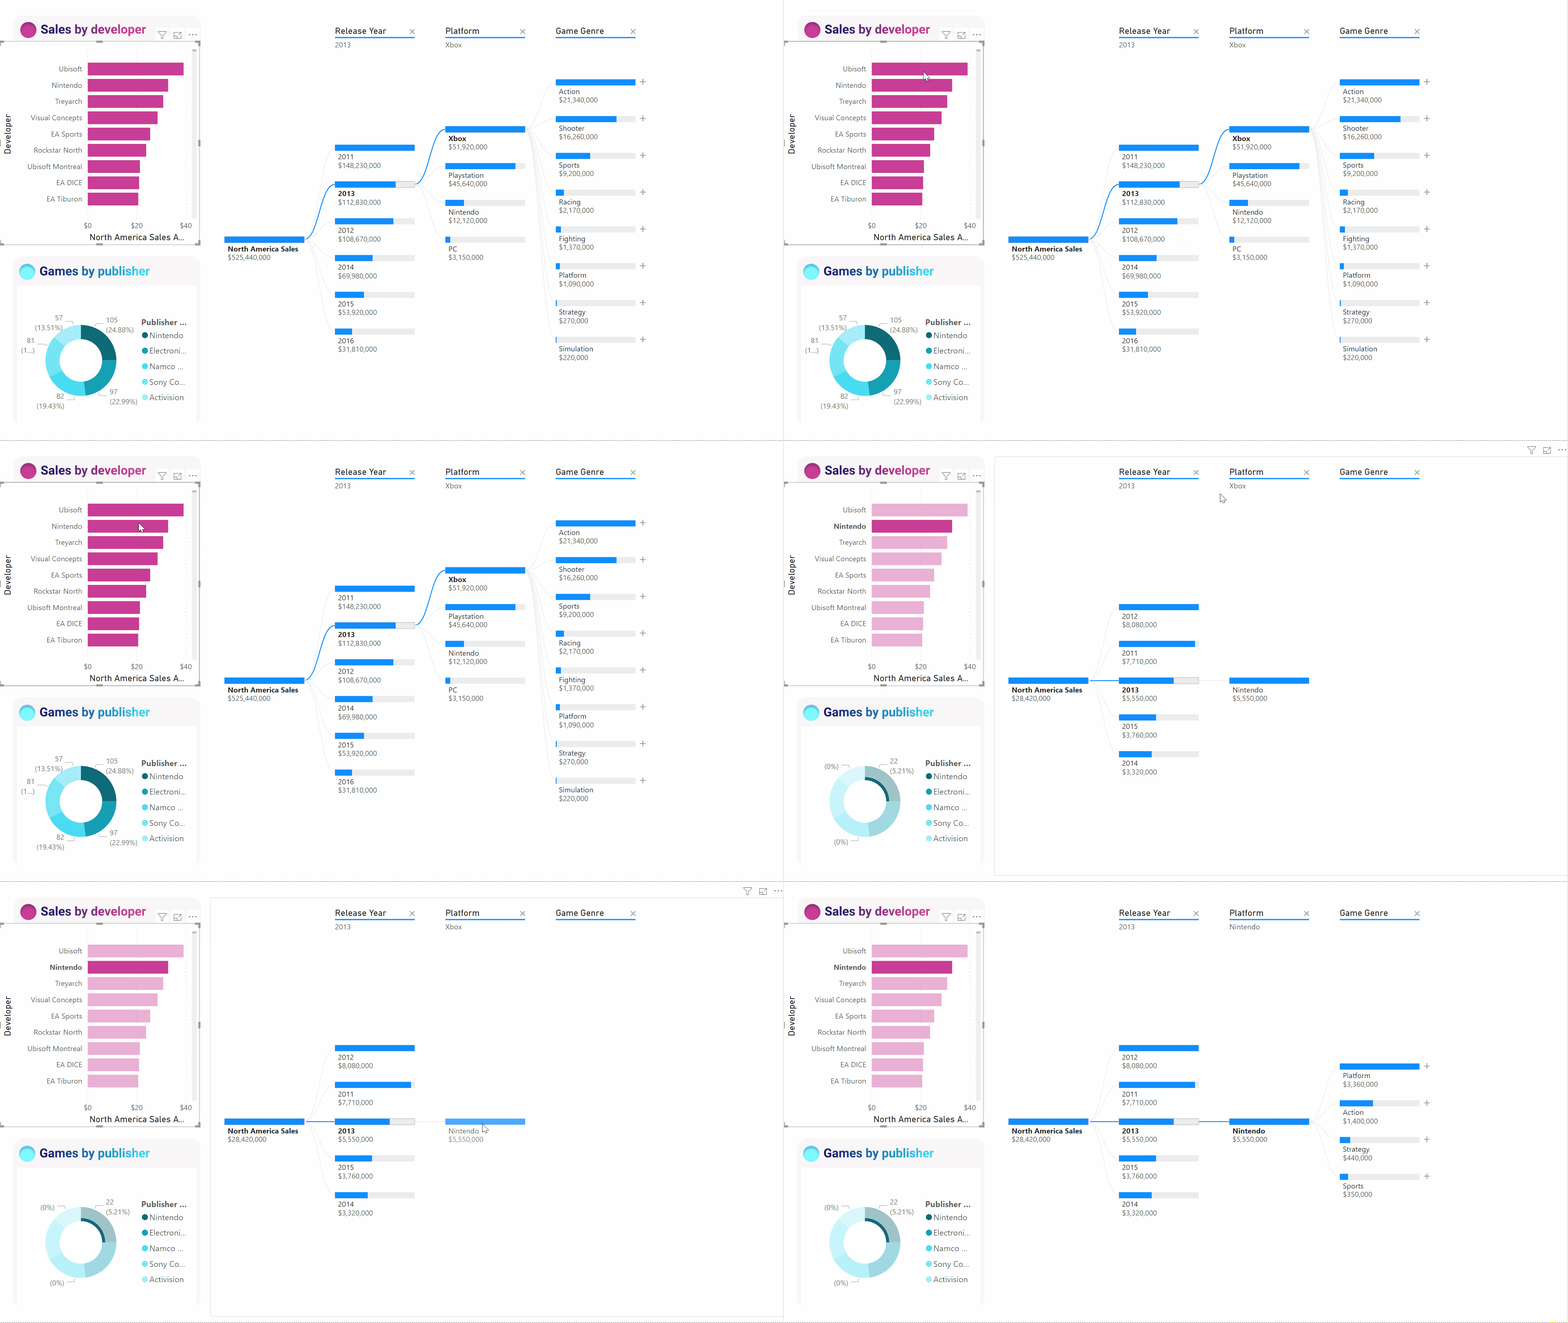
Finally, the Decomposition Tree visualiser allows you to drill down into your data based on certain criteria. As well as conducting root cause analysis, this powerful tool is great for digging into your data to get a better understanding of what factors affect what, and to what extent.
Top Tip: Connect and analyse your entire data estate by combining Power BI with Azure analytics services, including Azure Synapse Analytics and Azure Data Lake Storage, to analyse petabytes of data, use advanced AI capabilities, apply additional data protection, and more easily share insights across your organisation.
Want to explore more about Microsoft Power BI?
Check out some of the great videos and training guides below to get you started:
Video
Tutorials
Make the most of your Data with Power BI and Pinnaca
Get in touch today and we’ll see if you already have the tools in place to implement Power BI, and whether any changes to your existing Microsoft 365 licenses are required to get you going.
Are you purchasing your Microsoft Services
directly from Microsoft?
STOP we could save you £1000s a year with our Microsoft Invoice Challenge.
We have SAVED
£ 2000for our clients
As a Microsoft Partner & a Cloud Service Partner, we receive preferential *competitive* rates on all Microsoft services, where we can potentially save you money compared to going directly to Microsoft or another 3rd party reseller.
If you would like to explore how much we can save you, just upload your Microsoft services invoice to the form below, and we’ll get back to you with our money saving solutions.


